
Most Australian SMBs still spend 3 to 6 hours pulling reports manually every week. Here is the exact workflow LuciraFlow uses to connect your data, clean it automatically, and deliver live reports, without anyone touching a spreadsheet.
Every week, someone in your business spends hours pulling numbers from different systems, pasting them into a spreadsheet, formatting it, and emailing it to whoever needs it. By the time the report lands in their inbox, the data is already stale. This is the manual reporting cycle, and it is costing Australian SMBs far more than they realise.
Automated reporting does not just save time. It changes what decisions you can make. When your data is live and delivered automatically, you stop making decisions based on last week and start acting on what is happening right now.
The business case is well established. A recent survey of Australian SMBs found that 77% of businesses forecast that AI applied to operations and workflows could lift profitability, with 20% tipping gains of 21 to 30%. Writing and communication tools attracted similar optimism, with 75% believing AI could lift profits. (Source: Broker News, 2025)
Step 1: Connect your data sources
LuciraFlow connects to the tools you already use: your CRM, ERP, and spreadsheets. Custom-built connectors on Microsoft 365 handle the integration. No exports, no copy-paste, no manual data wrangling. Once connected, your data flows directly into your reports automatically.
Step 2: Let LuciraFlow handle the heavy lifting
Raw data is messy. Duplicate records, inconsistent date formats, mismatched categories across systems. These are the problems that eat hours during manual reporting. LuciraFlow handles all of it automatically: deduplication, normalisation, currency formatting, date alignment, and cross-system joins. By the time data reaches your report, it is clean, consistent, and ready to read. Your team never touches it.
Automation also handles scheduling. Reports run on your cadence (daily, weekly, or monthly) and are delivered to whoever needs them via email or a live dashboard. If a data source is unavailable, the system retries and alerts you rather than silently producing a broken report.
Step 3: Pick your report format
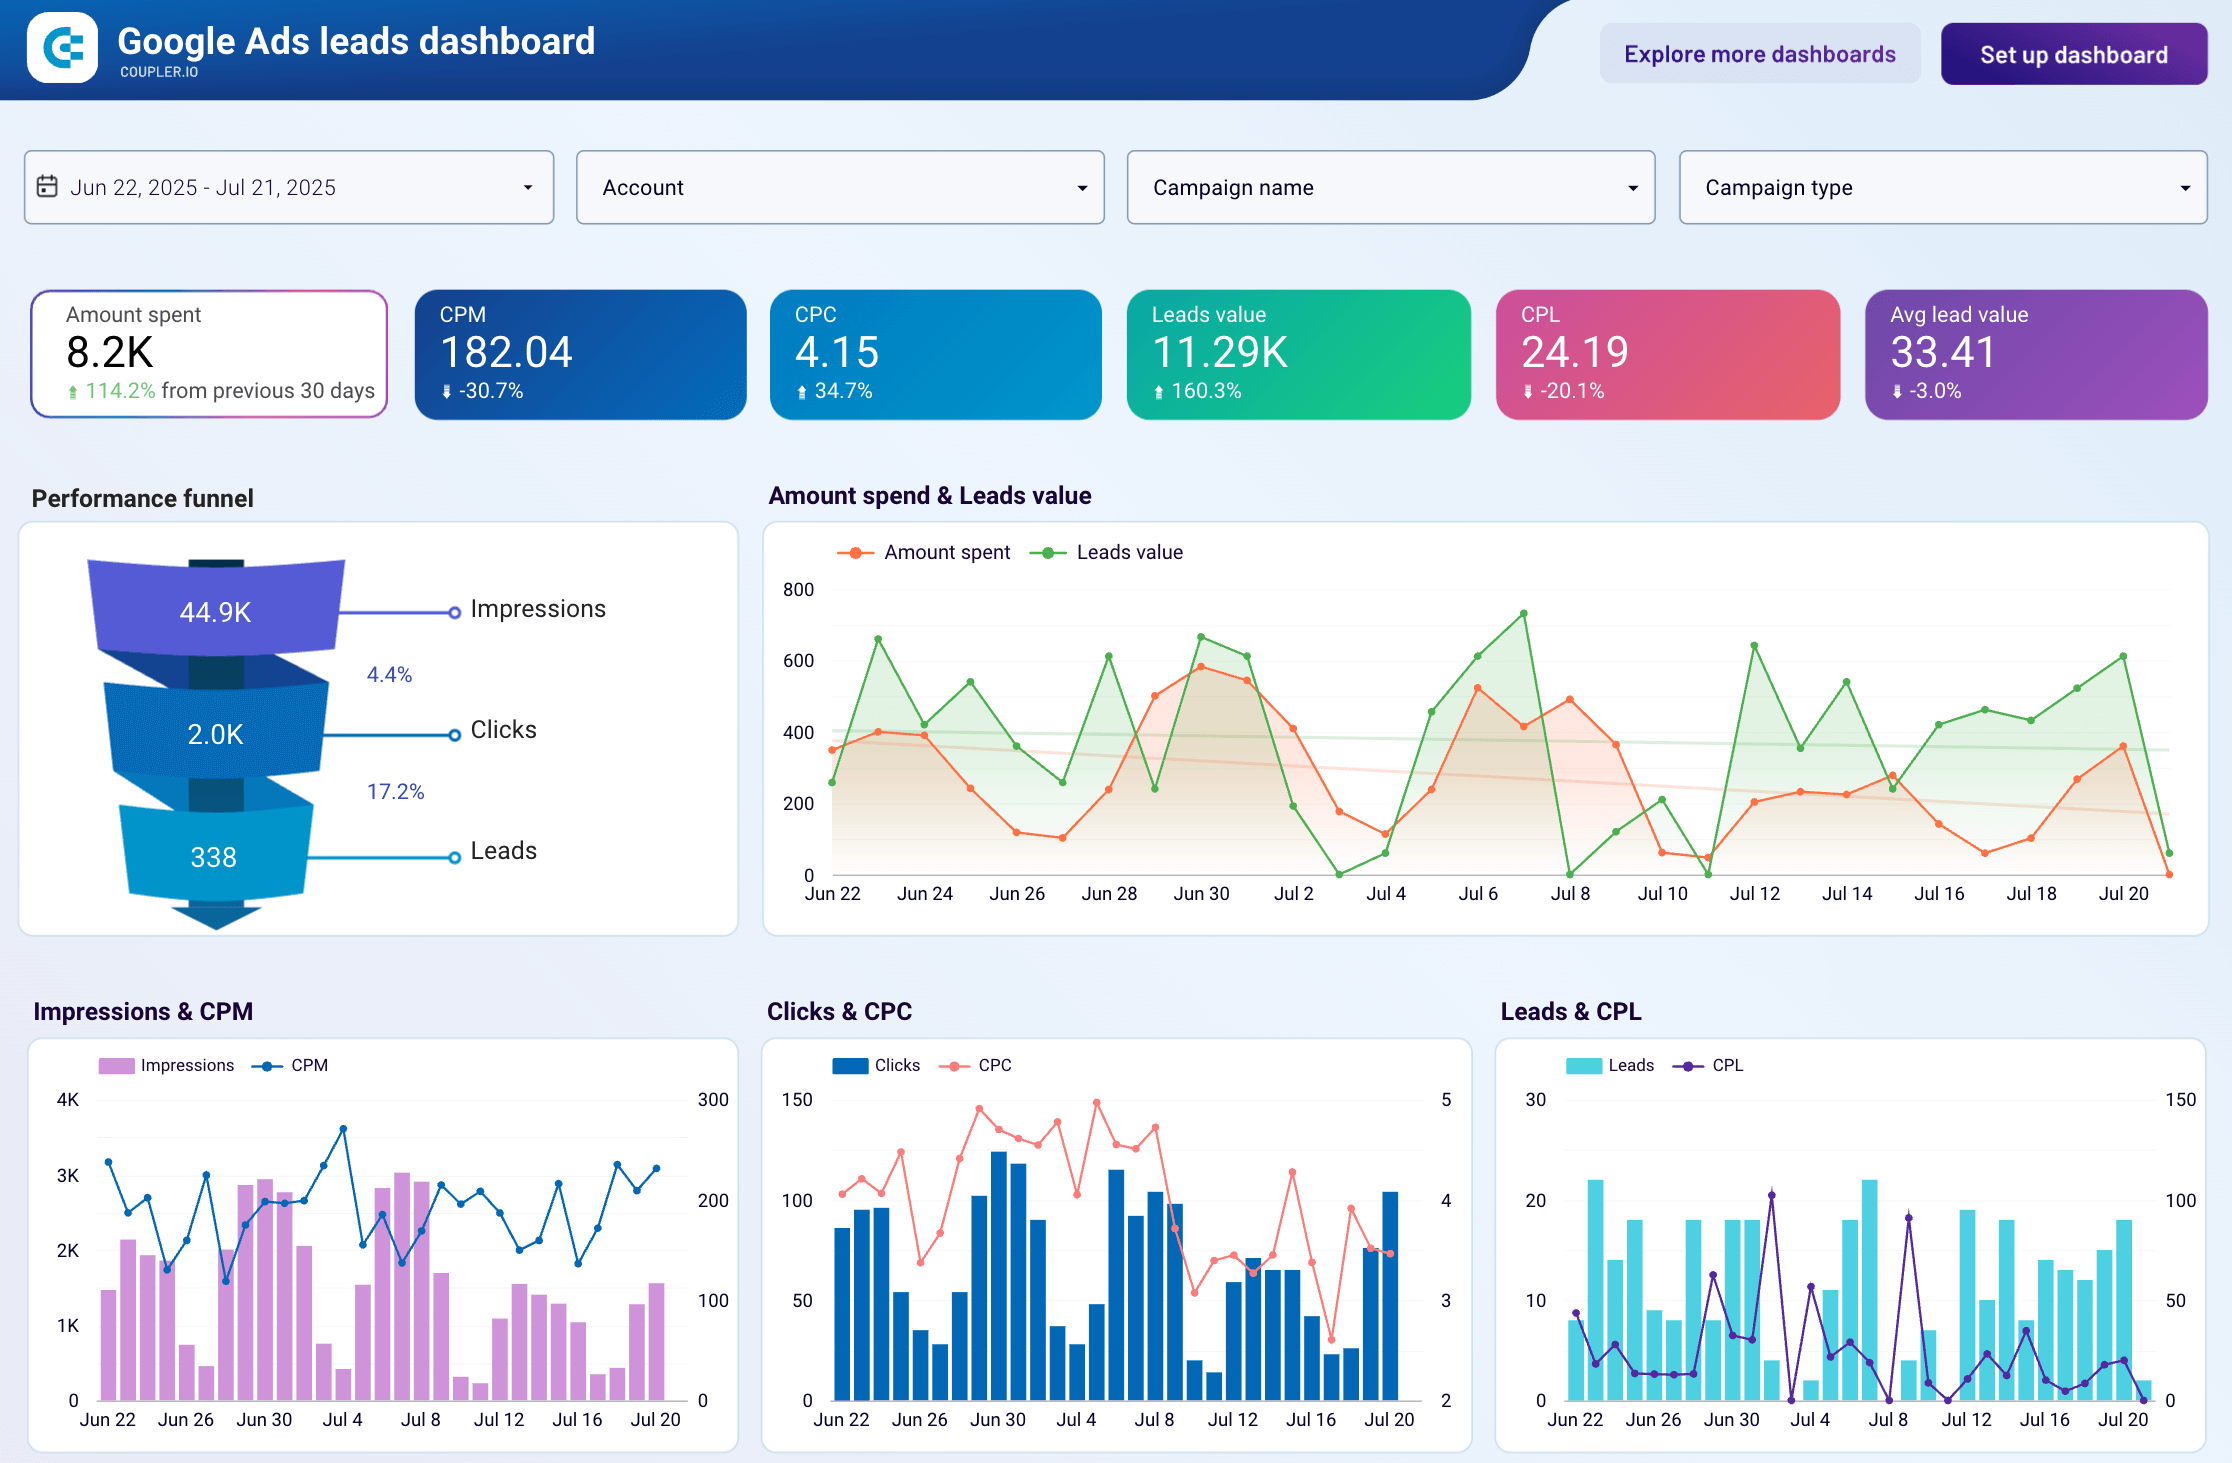
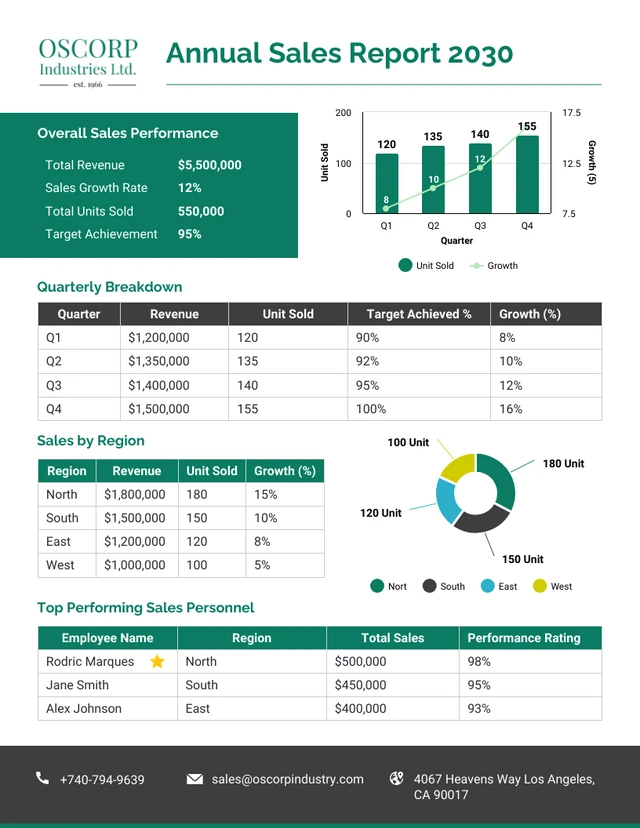
Not every business needs the same output. LuciraFlow builds to the format that actually gets used in your organisation: a live Power BI dashboard, a formatted Word document delivered by email, or a Looker Studio or Tableau report for teams already using those tools.
Manual reporting vs automated reporting with LuciraFlow
| Manual Reporting | Automated with LuciraFlow | |
|---|---|---|
| Time to produce | 3–6 hours per report | Minutes, runs automatically |
| Data freshness | As of last export date | Live or scheduled refresh |
| Human error risk | High. Copy-paste mistakes are common. | Near zero. Direct data pull. |
| Skill required | Excel or finance expertise | None after initial setup |
| Consistency | Varies by who builds it | Same format every time |
| Delivery | Someone emails it manually | Auto-delivered on your schedule |
| Ongoing cost | $30–$60/hr staff time per report | Fixed build cost + Microsoft 365 |
| Scalability | More reports = more hours | Add reports without adding time |
Get your free reporting audit
Tell us which reports your team currently builds manually and we will map out exactly what can be automated, how long it would take, and what it would cost. No obligation.